Berkeley Drosophila Genome Project
BDGP Resources
A P1-based Physical Map of the Drosophila Euchromatic Genome
Genome Research 6:414-430, 1996 William Kimmerly*†, Karen Stultz*†, Suzanna Lewis*§, Keith Lewis*†, Veronica Lustre*†, Raul Romero*†, Julie Benke*†, Dan Sun*†, Gail Shirley*†, Chris Martin*†, Michael Palazzolo*†§ *Drosophila Genome Center, †Human Genome Center of the Lawrence Berkeley National Laboratory §Department of Molecular and Cell Biology, University of California, Berkeley, 94720. William Kimmerly's current address is: Human Genetics Department, Glaxo Wellcome Research Institute, 5 Moore Dr., Research Triangle Park, NC 27709 Please send all correspondence to: Michael J. Palazzolo, Human Genome Center, Lawrence Berkeley National Laboratory, Building 74, Berkeley, CA 94720, Tel: 510-486-6932, Fax: 510-486-6816
ABSTRACT A PCR-based Sequence tagged site (STS) content mapping strategy has been used to generate a physical map with 90% coverage of the 120 Mb euchromatic portion of the Drosophila genome. To facilitate map completion, the bulk of the STS markers was chosen in a nonrandom fashion. To ensure that all contigs were localized in relation to each other and the genome, these contig-building procedures were performed in conjunction with a large-scale in situ hybridization analysis of randomly selected clones from a Drosophila genomic library that had been generated in a P1 cloning vector. At this point, the map consists of 649 contigs with an STS localized on average every 50 kb. This is the first whole genome that has been mapped based on a library constructed with large inserts in a vector that is maintained in Escherichi coli as a single copy plasmid.
INTRODUCTION The polytene chromosomes of Drosophila served as the original physical map (Bridges 1935). They allowed technical approaches to correlate the genetic map with physical locations on the chromosomes. With the development of in situhybridization procedures, the polytene chromosomes became an organizing resource that helped catalogue information concerning cloned sequences (Pardue et al. 1977). The polytene chromosome also served facilitating and validating roles in the initiation and error correction of the initial positional cloning experiments (Bender et al. 1984). The development of clone-based physical maps in other organisms identified some of the limitations of the polytene chromosomes (Coulson et al. 1986; Olson et al. 1986; Kohara et al. 1987). The direct access to mapped genomic regions in the clone-based maps eliminated the laborious and iterative procedures of chromosome walking. In addition, with the ambition toward whole genome sequencing, the clone-based maps promise to serve as intermediate sources of templates. To facilitate the experiments of the Drosophila research community and as a prelude to large-scale genomic sequencing, we set out to construct a physical map of the Drosophila genome. All those attempting physical mapping experiments face a similar set of strategic choices. The first choice concerns the type of cloning vector into which the fragments to be mapped are inserted. Common vector choices for library construction include l (Kohara, Akiyama and Isono 1987), cosmids (Coulson et al. 1986; Olson et al. 1986), P1 (Sternberg 1990), bacterial artificial chromosomes (BACs; Kim et al. 1992), P1 artificial chomosomes (PACs; Ioannu et al. 1994), and yeast artificial chromosomes (YACs; Burke, et al. 1987). The second choice involves the experimental mechanisms by which the overlaps will be detected, such as fingerprinting (Coulson et al. 1986; Olson et al. 1986; Sulston et al. 1992), in situ hybridization (Ajioka et al. 1991), or sequence-tagged sites (STS) content mapping (Olson et al. 1989). If the STS method of overlap determination is chosen for contig-building procedures, then the source of the STS probes must be decided. The physical map presented in this paper is based on a genomic library (Smoller, Petrov and Hartl 1991) constructed in a P1 vector system (Sternberg 1990)**.**The overlaps were detected by a PCR-based STS content-mapping strategy (Olson et al. 1989; Green and Olson 1990) in which the STSs were derived from the ends of the cloned P1 inserts that were selected from the library for STS generation in a non-random fashion (Palazzolo et al. 1991). It is important to note that this work was done as part of a larger collaboration within the Drosophila Genome Center (DGC). Other laboratories in the DGC include those of Gerald Rubin, Allan Spradling, and Daniel Hartl. It was possible to take advantage of other work in the center to provide experimental mechanisms to connect the contig-building experiments to both chromosomal locations and to the genetic map of Drosophila while simultaneously developing tools for error identification and correction. While the work described in this paper was being initiated, Hartl's laboratory was generating a framework map of the genome by using a large number of randomly selected P1 clones as a substrate for in situ hybridization to the Drosophila polytene chromosomes (Hartl et al. 1994). By using cytogenetically mapped P1 clones as sources for STS markers, all contigs were automatically assigned to specific euchromatic genomic locations. In addition, inconsistencies between the map based on in situ hybridization and the results derived from STS content mapping can be identified immediately and used to direct subsequent error correction experiments. To provide a more direct link between the physical map and the genetic map the organized set of P1 clones in this physical map is being used for additional STS content-mapping experiments using STS markers that are also genetically mapped. Hartl's group is using known genetic markers that have been cloned and sequenced by the research community. They are to design PCR primers used in STS mapping assays. In addition, Rubin and Spradling have collected a large number fly lines, each with an independently generated P-element transposition event as part of a large-scale gene disruption experiment (Spradling et al. 1995). These P-elements not only cause mutations but also carry easy-to-score dominant eye color mutations. The sites of P-element insertion are being used as sources of STS probes in an effort to increase the density of markers that link the genetic and physical maps. Taken together, these reagents promise to provide a useful set of tools for the Drosophila research community. The bulk of the euchromatic genome is now represented by mapped P1 contigs that have been localized to the genome and related to each other using molecular and genetic methods. Finally, large-scale sequencing of the genome is under way using these P1-based contigs as a source for template generation.
RESULTS The mapping project has passed through three stages: The first was the preliminary acquisition of resources; the second phase was the establishment of the production environment; and the third stage was the process of map building. Each stage is described in detail below. Stage 1: Acquisition Of Resources The project was initiated with the acquisition of three resources. The first of these was a multihit P1 library that was constructed using genomic DNA prepared from adult flies (Smoller, Petrov and Hartl 1991). The second tool was a P1-based framework map generated by an in situ hybridization analysis of a large number of randomly selected P1 clones (Hartl et al. 1994). The third tool was the implementation of a strategy that with a minimum number of mapped STS markers rapidly moves towards complete coverage (Palazzolo et al. 1991). Construction Of A Bacteriophage P1 Genomic Library With Drosophila Inserts. A Drosophila melanogaster genomic library was constructed (Smoller et al. 1991) using genomic DNA isolated from a mixture of both male and female flies from the isogenic strain iso1 (y; cn bw sp). Recombinant P1 clones were generated in two separate ligation experiments using two similar P1 cloning vectors, pNS583tet14Ad10 and pAd10sacBII (Fig. 1). A total of 3840 plates was isolated from the ligation of insert with the former vector. A second library, containing >18,000 clones, was generated in the latter vector. The average insert size of clones in the two libraries has been determined to be slightly larger than 80 kb by analyzing plasmid DNA prepared from a random sample of clones followed by restriction digestion and contour-clamped homogenous electric field (CHEF) gel analysis.
 Figure
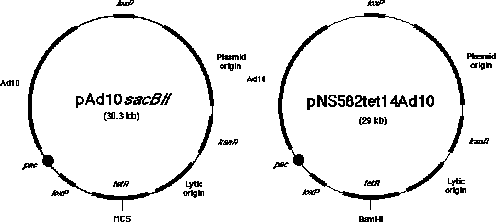
1. Two types of P1 vectors. The P1 mapping library consists of clones generated in two related P1 cloning
vectors. As described in the text, 3,840 clones were inserted into the vector known as pNS583tet14Ad10 and 5,376
clones were from the ligation mixture using the vector called pAd10sacBII. Both vectors contain genes that allow
resistance to the antibiotic kanamycin, a plasmid origin of replication that provides for a single copy, a lytic
origin of replication that can be induced by IPTG to allow 20-fold amplification of the plasmid, a loxP site
(the cis-acting site specific recognition signal for the P1 recombinase), and a gene that allows resistance
to tetracycline. Inserts cloned in the vector pNS583tet14Ad10 have been introduced into the BamHI site in
the gene allowing tetracycline resistance. A sacBII cassette was introduced by Sternberg (1990) as a means of
selecting for clones with inserts. The cloned inserts in this vector system are introduced between SP6 and T7 RNA
polymerase promoters that are positioned of the Bacillus subtilis genes found in the SacBII
cassette. The sequences between the loxP sites (containing the Ad10 sequences) are deleted during library
construction and thus are not present when the clones are mapped and eventually sequenced.
Figure
1. Two types of P1 vectors. The P1 mapping library consists of clones generated in two related P1 cloning
vectors. As described in the text, 3,840 clones were inserted into the vector known as pNS583tet14Ad10 and 5,376
clones were from the ligation mixture using the vector called pAd10sacBII. Both vectors contain genes that allow
resistance to the antibiotic kanamycin, a plasmid origin of replication that provides for a single copy, a lytic
origin of replication that can be induced by IPTG to allow 20-fold amplification of the plasmid, a loxP site
(the cis-acting site specific recognition signal for the P1 recombinase), and a gene that allows resistance
to tetracycline. Inserts cloned in the vector pNS583tet14Ad10 have been introduced into the BamHI site in
the gene allowing tetracycline resistance. A sacBII cassette was introduced by Sternberg (1990) as a means of
selecting for clones with inserts. The cloned inserts in this vector system are introduced between SP6 and T7 RNA
polymerase promoters that are positioned of the Bacillus subtilis genes found in the SacBII
cassette. The sequences between the loxP sites (containing the Ad10 sequences) are deleted during library
construction and thus are not present when the clones are mapped and eventually sequenced.
A subset of the clones was then selected for the mapping experiments. This subset included all the clones from the first ligation and 5376 clones from the second ligation. These 9216 clones were arrayed in 96-well microtiter plates and provide an estimated five- to sixfold coverage of the genome. Assuming random cloning efficiency for each region, it is reasonable to expect that the assignment of each of these clones to mapped contigs would provide coverage approaching 99% of the euchromatic genome. The remaining clones are being held in reserve and will likely be used in map closure experiments that aim towards mapping under-represented regions. A Framework Genome Map Based On In Situ Hybridization. With the development of the Drosophila P1 library the Hartl laboratory embarked on the generation of a map based on the cytogenetic localization of 2653 clones randomly selected from the mapping library (Hartl et al. 1994). This mapping resource provided three advantages: First, it tested the quality and randomness of the P1 library; second, it provided rapid P1-based coverage of ~80% of the genome to the Drosophila research community; and third, it established a large set of clones that could be used to generate an STS content map in which every third clone had already been localized to the genome by an independent experimental approach. The results from Hartl's laboratory suggest that the clones analyzed by in situ hybridization can be distributed into two different categories. The larger class contained 2317 members, each of which hybridized strongly to a single (or occasionally two or three) euchromatic sites. These results are compatible with the view that the bulk of the genome is organized into unique euchromatic regions. The presence of multiple hybridization signals, with one of the signals of significantly greater strength, is compatible with what might be obtained if a clone used as a hybridization probe carries one or more dispersed repetitive elements (a situation that should be common in a library that represents the Drosophila genome). The smaller class of clones contained 336 members, each of which hybridized to the chromocenter (the pericentric region and the Y chromosome, typically underreplicated in salivary gland cells) and/or multiple strongly hybridizing euchromatic sites. Clones that hybridize to the chromocenter are most likely to represent heterochromatic regions of the genome. A Non-Random Strategy For STS Selection Coupled To The Framework Map. One advantage of using a PCR-based STS content mapping strategy for the construction of physical maps is that the data from the ongoing project can be used in an effective fashion to guide the project towards completion. Specifically, computer simulations suggest that if, as the mapping project progresses, STSs are derived exclusively from the ends of the shrinking set of mapping clones that have not yet been assigned to contigs, then complete coverage is achieved through the mapping of three- to fourfold fewer STSs than if the STSs are selected randomly (Palazzolo et al. 1991) Experiments that coupled this nonrandom STS strategy with the framework map based on in situ hybridization analysis promise to lead directly to a map that provides nearly complete coverage of the euchromatic genome in which all contigs are oriented relative to one another and to specific locations on the polytene chromosome map. Stage 2: Establishing a production environment To approach the construction of a whole genome physical map it was important to develop a set of robust procedures that integrated the necessary biological, automation, and computational components. The biological requirements included developing effective procedures for the preparation of PCR templates from the P1 clones, PCR-based screens that employ an economical pooling strategy, establishing criteria that assess the quality of the mapping library, and a means to sequence the ends of the cloned P1 inserts to generate the STS markers. The automation needs included mechanisms to acquire, store, and retrieve rapidly the data associated with the agarose gel analysis of the PCR-based STS assays. The computational aspects of the project demanded that software tools be developed to manage and organize the data involved with this iterative mapping strategy in a logical framework, analyze the results of the mapping assays and organize the data into an accurate representation of the overlapping clones (or contigs), and integrate the data developed by the other projects in the DGC. Biological aspects of the production environment P1 DNA pools for PCR-based STS content mapping. The pooling strategy is a two-tiered one. The first level of screening uses 96 plate pools. Each plate pool contains the pooled P1 DNA from all 96 clones in a library plate. The second tier of pools consists of eight 12-member row pools and twelve 8-member column pools, a total of 20 secondary pools, per plate. To facilitate library screens that provide complete clonal identification, 2016 DNA pools were prepared. With this approach the mapping of a typical STS marker with five hits in the library requires 196 PCR reactions: 96 for the primary plate pool screen, followed by five sets of 20 second-round row and column pools to identify the five individual clones that share the STS marker (Fig. 2A).
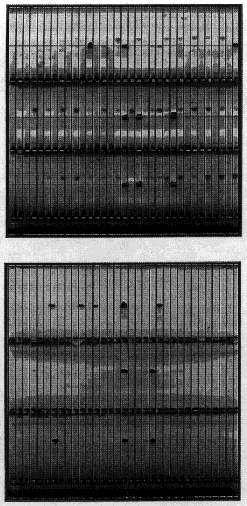 Figure 2A.
Example of STS mapping data The two images in this figure are of agarose gels stained with ethidium bromide
that are representative of the data generated in the course of the PCR-based STS content mapping assays.
(Top) A gel of the PCR assays used to screen the first tier of the plate pools. There are 96 plate pools,
each containing 96 clones. Each of the 96 assays are placed in an individual well of a single triple combed gel that
can accommodate > 100 lanes. Lane 17 in all three panels of the gel is a genomic DNA marker. In this image seven
of the plate pools are positive. (Bottom) Second tier of the STS screens. The row-column assays are
performed only on the positive pools identified in the first round. For each positive pool it is necessary to screen
8 row pools (containing DNA prepared from 12 clones) and 12 column pools (containing DNA isolated from 8 clones). The
signals used to identify an individual clone are always part of a matching pair of positive hits - one in a given row
pool and one in a given column pool. In this image, each panel of the gel represents a row-column assay. Using the
Angel analysis program, each assay identifies a row and a column hit lining up with the genomic marker in
lane 17.
Figure 2A.
Example of STS mapping data The two images in this figure are of agarose gels stained with ethidium bromide
that are representative of the data generated in the course of the PCR-based STS content mapping assays.
(Top) A gel of the PCR assays used to screen the first tier of the plate pools. There are 96 plate pools,
each containing 96 clones. Each of the 96 assays are placed in an individual well of a single triple combed gel that
can accommodate > 100 lanes. Lane 17 in all three panels of the gel is a genomic DNA marker. In this image seven
of the plate pools are positive. (Bottom) Second tier of the STS screens. The row-column assays are
performed only on the positive pools identified in the first round. For each positive pool it is necessary to screen
8 row pools (containing DNA prepared from 12 clones) and 12 column pools (containing DNA isolated from 8 clones). The
signals used to identify an individual clone are always part of a matching pair of positive hits - one in a given row
pool and one in a given column pool. In this image, each panel of the gel represents a row-column assay. Using the
Angel analysis program, each assay identifies a row and a column hit lining up with the genomic marker in
lane 17.
The DNA PCR template pools were generated by growing up the clones of an individual microtiter plate in a titer tube box. Each tube contained 0.4 ml Terrific Broth (TB) plus kanamycin. The titer tube boxes were incubated at 37°C overnight with shaking. Each clone was grown individually with good aeration, prior to pooling, to avoid sib competition. Assays using templates prepared from growth without agitation resulted in an inordinate number of false-negative results in control experiments. The pools from the aerated cultures were made by combining the appropriate clones. The DNA from the large insert plasmids was obtained by following a standard Triton-lysozyme boiling DNA preparation protocol (Smoller et al. 1993). The amounts of purified template in each of the pools were sufficient to allow the performance of > 15,000 STS screens. Pilot scale tests to assess the quality of the library and the effectiveness of the PCR-based STS assays. Initially the validity of the pooling and PCR mapping procedures were tested on a small scale by building contigs that covered two Drosophila homeo box gene clusters: the Bithorax complex (BX-C) and the Antennapedia complex (Ant-C) (Fig. 2B). The initial approach to building a contig covering the BX-C involved designing STS markers using published cDNA and exon sequences from the regions that were available in GenBank. We used cDNA sequences encoding the 5' and 3' exons of abd-A (Karch, et al. 1990), the 5'-most and 3'-most exons of Ubx (Kornfeld et al. 1989) and an exon from abd-B (Celniker et al. 1989) to design primers for PCR. These primer pairs were then used to screen the P1 library to identify P1 clones containing the STS sequences. After screening the library with these STS markers, a contig of four P1 clones was constructed that covered the genomic region encoding abd-A and Ubx. However, a gap remained between this four-member contig and a P1 containing the abd-B gene. To close this gap, we designed two additional STS markers to the ends of two P1 clones flanking the gap. When these STS markers were used to screen the library an additional P1 clone was identified which contained both STS markers. Thus the resulting minimal tiling path contig contained six P1 clones (out of a total of 21 P1s identified by all screens) and was defined by six STS markers. Using a similar strategy, we next built a contig covering the ANT-C, a related multi-gene complex located on chromosome 3R at polytene divisions 84A-B (Wakimoto et al. 1984). We designed a total of nine STS markers to the following genes: Antp (3 exons), pb (2 exons), ftz, lab, Scr, and bcd. These nine STS markers identified 21 clones. A subset of these P1 clones formed a minimal tiling path that represented both Hox clusters. Clones from this minimal set were used to generated a probe used in in situ hybridization assays to the polytene chromosomes. All clones tested in this fashion were localized in the appropriate unique genomic regions, simultaneously verifying the quality of the library, the template pools, and the effectiveness of the PCR-based STS mapping assays. These fourteen P1 clones were selected for directed genomic sequencing. The entire Bithorax complex (Martin et al. 1995) and > 95% of the Antennapedia complex has now been sequenced at the Drosophila Genome Center. All of the mapping and sequencing results to date are completely consistent with the notion that the P1 clones in these contigs accurately and faithfully represent these two extensively studied regions. This data will be described more fully in a manuscript currently being prepared that describes the sequencing approach that we are using.
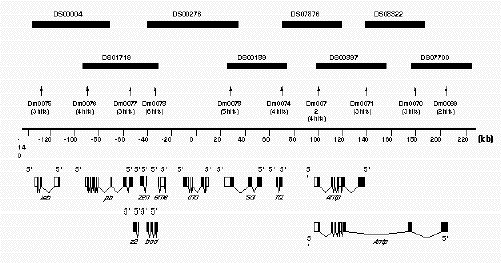 Figure 2B.
Example of the Ant-C contig A diagrammatic representation of the contig developed to represent the
Antennapedia complex. Only the minimal tiling path of P1 clones is presented by the solid rectangles in the
upper part of the drawing. Each P1 clone is identified by its unique number (DS#). The numbers below the shaded
rectangles (Dm#) correspond to the names of the STS sequences used to screen the library to identify each of the P1
clones. In parentheses below each of the named STS are the number of P1 clones identified by each STS. For example,
STS Dm0073 identified six P1 clones. The scale bar is in kbp. The drawings at the bottom of the figure
represent the known exonic sequences, from which most of the STS markers were derived.
Figure 2B.
Example of the Ant-C contig A diagrammatic representation of the contig developed to represent the
Antennapedia complex. Only the minimal tiling path of P1 clones is presented by the solid rectangles in the
upper part of the drawing. Each P1 clone is identified by its unique number (DS#). The numbers below the shaded
rectangles (Dm#) correspond to the names of the STS sequences used to screen the library to identify each of the P1
clones. In parentheses below each of the named STS are the number of P1 clones identified by each STS. For example,
STS Dm0073 identified six P1 clones. The scale bar is in kbp. The drawings at the bottom of the figure
represent the known exonic sequences, from which most of the STS markers were derived.
Developing end-specific STS markers. A crucial aspect of using a strategy based on the acquisition of STS probes from the ends of cloned P1 inserts is the ability to elucidate the sequences of the inserts immediately adjacent to the vector cloning sites. It is also important to note that successful primer design is dramatically enhanced if the derived sequence is of relatively high quality. With this in mind, we have attempted to develop approaches that aim towards the single pass generation of at least 350 bp at each end of the cloned insert with an accuracy rate of ~ 98%. Four different protocols have been developed and implemented within DGC to generate end sequence-specific STSs. The first procedure is based on the direct sequencing of P1 DNA purified from a 15-ml overnight culture using an alkaline lysis methodology (Kimmerly et al. 1994). This approach is most effective for the clones inserted into the pAd10sacBII version of the vector in which the cloning sites are flanked by SP6 and T7 primer binding sites. We have not yet been able to develop effective primers for direct sequencing of pNS583tet14Ad10 P1 clones. The second procedure developed for end sequencing is a variation on the first. It is based on the finding that more robust templates can be produced after transfer of the P1 plasmid to Escherichia coli strain DB>0B from the NS3529 strain. Post-transfer processing of plasmid DNA was identical to the alkaline lysis plasmid preparation procedure mentioned above. The transfer has been effected via several mechanisms, but the technique judged most straightforward on a large scale requires two bacterial mating steps: The first introduces an F factor into NS3529 containing a P1 clone of interest, and the second transfers both the P1 clone and the F factor to DB>0B. There are two possible reasons for the difference in template quality of P1 DNA isolated from DB>0B versus the library host strain NS3529. First the endA mutation has been reported to increase the quality of DNA sequencing templates prepared in such strains (Taylor et al. 1993). In contrast to NS3529, DB>0B carries an endA mutation. Another potentially significant difference is that NS3529 carries the cre recombinase, an enzyme that is not present in DB>0B. It has been noted that plasmids that contain lox sites (as the P1 cloning vectors do) can be difficult to isolate from strains that express the cre recombinase (Palazzolo et al. 1990). The third technique used to sequence insert ends is that of "bubble" PCR (Riley et al. 1990; Smith 1992; Nurminsky and Hartl 1993; Hartl et al. 1994). Ligation of a double-strand linker to fragments of restriction digested P1 DNA followed by PCR using a primer to the vector junction region and a primer complementary to the linker promotes the selective amplification of fragments that are adjacent to known vector sequences. These amplified molecules can then be sequenced in either orientation using primers that bind to sites in the vector or primers that bind to the linker. A fourth approach is a technology based on bacterial transposon insertion coupled to PCR. After F'-mediated transfer of a P1 clone to another host strain, a transposon is acquired and stably maintained as an insert in the P1 plasmid. PCR with a primer specific to the P1 vector sequence near the cloning site and a inverted repeat primer can generate a product with a pool of mating transductants as template. The smallest products typically outcompete larger ones so that in the majority of cases an end-specific fragment, a few hundred base pairs in size, can be amplified from a pool of a few hundred P1 clones each of which contain a different transposition event. Direct sequencing of PCR products generated by either of these two schemes allows the generation of STS markers from P1 clones that cannot be sequenced directly. These four approaches to end sequencing differ both in degree of difficulty and reliability. The easiest protocol is the one based on direct sequencing. However, this protocol only produces sequences that can be routinely used to design successful PCR primers about one-third of the time. In contrast, the same protocol can be used to successfully prepare effective templates for direct sequencing of P1 clones ~ 70% of the time if the P1 plasmid has been transferred to the DB>0B strain. The bubble PCR approach is attempted to obtain end sequence from the ~30% of clones that are refractory to a direct sequencing approach. Templates that fail to generate useful data when sequencing attempts using both direct and ligation-mediated PCR approaches are examined using the transposon-facilitated approach. As mentioned above, it is noteworthy that we have been able to use the direct sequencing protocols only on the clones in the pAd10sacBII vector. For this reason, the bulk of the STSs in the map was derived from this subset of the library. Bubble PCR-based sequencing is the first choice protocol of clones in the pNS583tet14Ad10 vector. To date, we have developed 2394 STSs from the ends of P1 clone inserts. There are only 40 targets (40/3632 preps or 1%) that have shown to be refractory to all of the potential methods for end sequencing described here. Automation aspects of the production environment. The map generated at this point has required the performance of ~3,500 sequencing reactions, approximately synthesis of ~2,470 oligonucleotides, ~605,000 PCR reactions, and ~8,250 agarose gels. At the beginning of this project fluorescent sequencers and thermocyclers were available commercially. Although oligonucleotide synthesizers were also available commercially, custom services were also an option. We decided to use this available instrumentation to meet our production needs. Specifically, the sequencing reactions used to develop all the STS markers have been acquired using an ABI 373 sequencer, the PCR reactions were all performed on Perkin Elmer 9600 thermocyclers, and the oligonucleotides were obtained commercially from Genset Corp (La Jolla, CA). Agarose Gel Imaging Station. Our mapping strategy entailed the analysis of thousands of agarose gels. The major missing piece of automation was an instrument that could acquire and store retrievable images of the agarose gel analyses of the PCR-bases STS mapping assays. To solve this problem the Automation group at the Lawrence Berkeley National Laboratory (LBNL) Human Genome Center, under the direction of Joseph Jaklevic, developed an automated gel imaging station. This instrument will be described in detail elsewhere, but is summarized briefly here. The image station is a computer coordinated system that includes a cooled charge-coupled device (CCD) camera, an UV light source, and associated instrument control and image analysis software. A digitized image of an agarose gel can be acquired in a few seconds by Optimas imaging software. The image files are initially stored in a proprietary PMI format and later converted to GIF format for analysis on a Sun workstation using the gel analysis program, Angel (see below). An image annotation program written in Visual Basic by Terri Fleming of the LBNL HGC Informatics (HGCI) group is associated with image acquisition. The program provides data fields for the entry of information that describes each image such as plate pool versus row/column experiment, STS information, PCR parameters of the mapping experiment, and the identity of the individual who performed the experiment. This information is retained as a text file that remains associated with the image file for subsequent analysis. Custom Agarose Gel Hardware. Automated and semiautomated analysis of agarose gels requires that the gels are always generated in a common fashion with a fixed lane and sample loading format. This system was also developed by the LBNL Automation group and will be described in detail elsewhere. However, its utility for the physical mapping project is discussed below. The agarose gels used to analyze the STS mapping experiments were molded using custom 14 x 14-cm gel casting trays, fitted Plexiglas support plates, and a custom triple-comb assembly built by the Automation group at LBNL. The triple-comb assembly divides each gel into three panels, each containing 33 lanes. Each panel therefore has sufficient lanes to load 32 plate pool samples plus a control sample, which is the PCR product generated by assaying Drosophila genomic DNA for the given STS. Therefore, on a single agarose gel, an entire plate pool experiment representing the 9,216-member P1 clone library can be analyzed. Agarose gels for the analysis of row/column experiments were cast in the same format. The PCR reactions representing the twenty row and column pools and a genomic DNA standard were loaded on a single panel of these gels. Thus in contrast to a plate pool gel, a row/column gel treated each panel as a separate experiment; each panel represented a different set of row and column pools, and perhaps a different STS marker. The gels were loaded manually using either 8 channel multi-pipettes for plate pools or 12 channel multipipettes for row/column gels directly from the Perkin Elmer 9600 trays. The 14 x 14-cm gel size is compatible with the commercially available electrophoresis boxes from Biorad (Hercules, CA). The lids of these gel boxes were customized by the Automation group to provide fans for cooling. The use of fans allows the gels to be run at much higher voltages without the generation of heat-induced mobility artifacts. Informatics issues in the production environment. As mentioned above, the informational needs of the project are numerous and varied (Fig. 3). The first task is the maintenance and integration of the data from the different projects in a fashion that is accessible to all the researchers on the project. Second, it is important to be able to deal with the P1-end sequence data and convert these sequences into STS markers that can be used efficiently in contig-building experiments. Third, it is important to analyze rapidly and correctly the PCR-based mapping assays and correctly report the results to the mapping database. Furthermore, it is useful to re-examine data in those cases where conflicts are apparent. The fourth and final data analysis task is to bring all the information together and develop a graphical representation of how all the data from the mapping and sequencing projects fits together in a unified vision of the current status of the map.
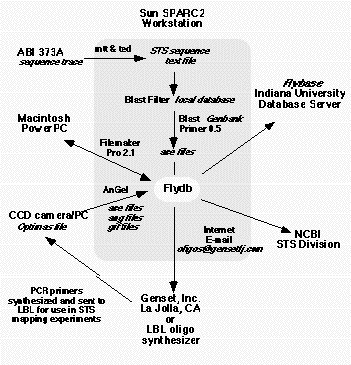 Figure
3. Data flow The data flow in the mapping project has to allow the introduction of sequencing trace files
from the Macintosh computer associated with the ABI 373 sequencers and the gel image files associated with the
Gateway PCs that drive the image acquistion on the LBNL gel imaging station. The information flow is described in
detail in the text.
Figure
3. Data flow The data flow in the mapping project has to allow the introduction of sequencing trace files
from the Macintosh computer associated with the ABI 373 sequencers and the gel image files associated with the
Gateway PCs that drive the image acquistion on the LBNL gel imaging station. The information flow is described in
detail in the text.
Flydb Suzanna Lewis developed a database for the Drosophila Genome Project called Flydb. Flydb is a variant of ACeDB (a Caenorhabditis elegans data base), which was originally written and developed by Richard Durbin (Sanger Center, Hinxton, England) and Jean Thierry-Mieg (CNRS Montpellier, France) to support work in C. elegans (Dunham et al. 1994). The initial purpose of Flydb was to provide support to the four laboratories in the mapping collaboration. To achieve this goal, Flydb supports the collection of data from each contributor, curation and consolidation of this data into a master database, summarization of these results in concise graphical displays, and distribution to the collaborating labs. The customization required a new set of graphical displays, modification and enhancement to graphic utilities and tools to allow programmatic access to the database. One chromosome arm at a time is represented in the graphical display, shown both as a simple line that functions as a scroll bar that allows users to visualize a specific region in detail. In addition, the display can be positioned simply by clicking on a particular chromosomal division. A graphical representation of the polytene chromosome bands in which the length of a band is proportional to its DNA content is also displayed. The remainder of the screen shows a variety of genetic and clone markers. Users can select the sets of markers that are displayed. In the original version of Flydb that served as our lab notebook the choice of markers included STSs, YACs, P1 clones, P1 contigs and P elements. In addition, users can retrieve more detailed descriptions of the data. STS primer design. Fly_by_night is software developed by Suzanna Lewis, Henry Cobb, Gregg Helt (Drosophila Genome Center), and Sam Pitluck (Lawrence Berkeley National Laboratory) that manages the data flow associated with the process of the conversion of P1-insert end sequence into PCR primers that can be used to screen the mapping library. Using this software, trimmed and edited trace files associated with each new sequence are searched using the BLASTN algorithm (Altschul et al. 1990) against a local database that contains all the previously designed STS markers, all known fly repetitive elements, and members of gene families such as histones or tubulins. If an identity is found in the local database, the sequence is filtered out and an STS is not generated from it. Novel sequences are presented to the Primer 0.5 program developed at the Whitehead Genome Center (S. E. Lincoln, M. J. Daly, and E.S. Lander). The program identifies primers that can be used to generate a PCR product in the range of 15-300 bp. Once primers have been designed, fly_by_night assigns an STS number chronologically to each primer pair/sequence set. The software then searches GenBank using BLASTN to identify any characterized previously fly sequences. About 5% of the P1 end sequences match a Drosophila sequence that has been previously deposited in the public databases. Next the script archives all files associated with each STS to appropriate storage directories and all data concerning the STS sequences, primers, and BLASTN search results are read into Flydb. Finally, PCR primer orders can automatically e-mailed to a commercial oligonucleotide supplier or to the LBNL oligonucleotide synthesizer (Sindelar and Jaklevic 1995). Analysis of STS mapping assays Angel is a gel image analysis program, adapted by Sam Pitluck and Terri Fleming of the LBNL HGCI group, to allow a computer-assisted mechanism for scoring and interpretation of the STS mapping gels. Angel can operate in either a plate pool or row/column pool analysis mode. By examining the digitized images from the image station, the user identifies the positive control (the PCR product generated from genomic DNA) on each panel of the gel. Corresponding positive signals are then identified by clicking on each band with the mouse. The only automated function Angel provides is lane finding. Specifically, the position identified by the operator is translated, with reference to an underlying X-Y coordinate map of the gel image, to the appropriate pool that corresponds to the lane in question. The deconvolution of the pool information is written to a text file along with appropriate attributes. These files are read directly into Flydb where pool and clonal identity are calculated. The user-assisted analysis mode facilitates the correct scoring of weak signals and also affords the trained eye an opportunity to sort through specific results in mapping experiments where nonspecific bands are also present. Contig building. The contig assembly algorithm utilized in the Drosophila project is called Spam and was developed by Suzanna Lewis. The difficult computational issue in physical mapping is reconstructing a representation of each chromosome given data describing likely overlaps among members of a fragment library derived from genomic DNA. The essential algorithm relies upon the observation that any set of STSs hitting an individual clone should appear consecutively in the finished ordering. Conceptually, the input data are a matrix in which an individual STS is a row, an individual clone is a column, and the value of each cell indicates the positive or negative result for that STS. If the data are error-free then there must exist some ordering of the rows (STSs) such that the positive scores appear consecutively, without any gaps, for every clone column. As the data are not error-free the goal is to recover the most likely underlying order and enumerate and describe those data that prevent this map from being perfectly ordered. The current approach uses the PQ free approach of Booth and Leuker (1976) to set the upper bound for a subsequent branch and bound algorithm. This restricted set of possible errors is thus available to the biologists for their use in choosing the most informative experiments to perform to resolve these discrepancies in the data. Two additional types of information are available and incorporated into our map-building algorithms. Almost 30% of the P1 clones have been localized by in situ hybridization. The level of resolution of this analysis is about ~50-100 kb. A position can be assigned to each localized clone that is expressed in kb and is derived from the polytene chromosome assignment, which has been translated using estimates of DNA content per band (Sorsa 1988) to a distance measured from one end of the chromosome arm. These localization data are used to screen for potential false positives, chimeric clones, and repeat sequences. The second type of information available is that most of the STS markers is paired. Because both ends of a P1 clone are sequenced, most of the STS probes originating from the library have a corresponding STS that shares the same P1 source and these two STSs are separated by ~80 kb. This relationship is useful for comparisons, as one can expect these paired STSs to identify clones that represent a common chromosomal region. Stage 3: The current state of the P1-based STS content map of the Drosophila euchromatic genome. Strategy and expectations. As described above, one of the key strategic decisions made in the experimental design was to couple the results of the framework in situ hybridization map with a nonrandom STS content mapping approach. Specifically, a list of the euchromatic clones localized by Hartl's group was maintained throughout the project. Clones shown by their polytene localizations to be nonoverlapping were selected as STS sources, and the ends of these cloned inserts were sequenced. PCR primers were designed on these sequences, and the P1 library was then screened. This process was repeated in an iterative fashion, excluding as STS sources all clones already assigned to contigs by the previous PCR-based mapping assays. Since the library is approximately five hit, each STS assay should identify 5-6 additional clones, and 11-13 member contigs should be generated with each paired mapping assay. Additionally, each of these contigs should cover, on average, ~200 kb. The directed nature of the STS selection scheme continually forces the mapping of regions that are not yet covered by contigs. Furthermore, all contigs are genomically localized because every P1 clone that is used as a source of paired STS markers has already been localized by in situ hybridization. Computer simulations of the strategy, based on the assumptions that the euchromatic genome is 120 Mb and that the cloned inserts are ~80 kb in size, suggest that 1800 paired, non-random STS mapping assays would provide coverage that slightly exceeds 99%. The current state of the mapping effort is summarized in Table 1. The main features summarized include the number of STS markers mapped, the number of clones localized to contigs, the number and size of contigs, and the fractional coverage of the genome provided by the mapped contigs. Each of the results is described in more detail in Table 1 and below.
**Table 1 Summary of the current status of the physical map of the Drosophila genome ** | | | |---------|---------------------------------------------------------------------------------------------------------------| | Results | Experimental category. | | 2155 | Number of P1-end STS markers mapped (1622 paired and 533 unpaired) | | 2352* | Number of euchromatic clones localized by in situ hybridization | | 261 | Number of euchromatic clones cytogenetically localized but not yet assigned to contigs by STS content mapping | | 336 | Number of P1 clones identified by in situ hybridization to chromocentric regions of the polytene chromosomes | | 6384 | Total number of clones assigned to cytogenetically localized contigs | | 2832 | Total number of clones not yet assigned to contigs | | ~ 110Mb | Estimated euchromatic coverage | | 649 | Estimated number of contigs | | 170 kb | Average contig size | | 5.04 | Total hit average | | 5.2 | Autosomal hit level | | 3.8 | X-chromosome hit level |
*35 of the clones localized by in situ hybridization were done by Todd Laverty (BDGP).
STS markers and contigs. To this point, 2397 STS markers have been mapped completely. These probes have been developed from the sequences at the ends of 1344 cloned P1 inserts that had previously been identified as euchromatic. Most of the markers (1622) are paired -- derived from opposite ends of the same cloned insert. The remainder (533) represent sequences at one end of a cloned P1 insert. We made significant efforts to work exclusively with paired STS markers. However, in some instances the ends were resistant to sequencing, the developed PCR primers failed after two attempts, or repeat sequences were identified at one of the ends. A major feature of the map is that there is now a sequenced and mapped STS on average every 50 kb in the Drosophila euchromatic genome. A major initial goal of the mapping project was to assign all the euchromatic clones to contigs by STS mapping. Of the 2317 clones identified in the course of the framework effort of the Hartl group, 2091 have now been positioned into sets of overlapping clones with the detection of molecular overlaps. Only 88 clones from this euchromatic collection remain as localized singlets. Repeated efforts to develop unique STS markers from the ends of the inserts in these clones have failed. It is important to note that the majority of the clones in the canonical mapping library were unselected by the Hartl group in the generation of their map based on in situ hybridization. A large fraction of these clones have now been localized as part of the contig-building experiments. Specifically, of 9216 clones, 6384 are now members of localized contigs, whereas 2832 clones remain unlocalized by STS mapping assays. Of these clones, 197 were characterized as heterochromatic in the in situ-based mapping experiments. There remain 2017 clones that are currently unassociated with any mapping data. That is, these 2017 clones have not been used as probes for in situ mapping, as sources of STS markers, or been hit by any of the STS markers mapped to date. Estimating contig sizes and coverage in STS-based mapping projects can be problematic. In constrast to fingerprinting mapping techniques, STS content procedures provide little insight into physical size between markers. For this reason, contig size and coverage are frequently based largely on statistical considerations. At this point 6,384 clones have been assigned to localized contigs. If one assumes that the euchromatic genome is 120 Mb and all the mapped clones are 80 kb in length, then the total DNA content of the mapped clones provides represensation of more than four genome equivalents. If one makes the further assumption that the mapped clones represent the genome in a Poisson fashion, then the coverage might exceed 97%. However there are a number of reasons why the mapped clone collection might deviate from randomness. For example, most cloning systems suffer a representation bias based on biological mechanisms. Thus, we believe our current map to be less than the statistical ideal but think it unlikely that it does not provide coverage of 90% of the euchromatic genome at this point. The contig assembly program outlined above, uses the STS mapping data to assemple P1 contigs of overlapping clones. According to this analysis, the current physical map is distributed in 649 contigs, 4 of which are > 500 kb. If, as suggested above the estimated coverage is ~110 Mb then the average contig size is ~170 kb. Heterochromatin in the P1 Library. The in situ hybridization analysis of 2653 euchromatic P1 clones by Hartl and co-workers identified 336 P1s that exhibited a repetitive or chromocentric staining pattern. As the data suggest these clones are likely to be heterochromatic, they were intentionally not selected in the initial mapping effort as sources for STS markers. However, these clones are members of the canonical library from which the template pools were generated for STS content mapping. Most of these clones were not hit in the screens. This is not surprising as the STS markers were selected from clones thought to be euchromatic. However, the data from the STS assays suggest that 151 of these clones may be euchromatic as they are hit by at least one presumptive euchromatic STS. In addition, 44 of these repetitive P1 clones appear to be convincingly euchromatic because they are hit by at least two STS markers, and in each case both markers exhibited a consistent genomic localization. The true fraction of clonable heterochromatin in the library and the ability to assign these clones to unambiguous contigs is the focus of ongoing experiments (see Discussion). False Positives, False Negatives, and Chimeric Clones. Like most experimental procedures, physical mapping is prone to both false negatives and false positives. As the STS markers have been derived from identified clones the false-negative rate can be estimated. Specifically, an estimate of the false negative rate is derived as the number of cases where an STS designed to a P1 insert end does not identify its source divided by the total number of mapped P1 end-derived STS markers. The current figure for this event is 12% (252/2155). We believe this figure to be a maximum estimate of the false negative rate because there are other explanations of the failure of a P1 end STS to identify its source. One cause of over-estimation of the false-negative rate is attributable to misidentity of the source clone. Human error occasionally results in a mapping clone being misnamed. When mapped, the STS markers derived from the clone would not hit the presumptive source, but, instead hit the actual source. These errors are often easy to identify, and their correction is an ongoing process. One way to estimate the false-positive rate in the STS mapping experiments relies on the cross-correlation of in situ hybridization data and contig placement data to accept or reject hits used for contig building. An estimate of the false positive rate in the STS mapping experiments is obtained by dividing the total number of unused (rejected) hits among all STS markers by the total number of hits. This figure is currently 1.7% (181/10,812). In this case we believe the figure to be an underestimate of the true false-positive rate because the identification of false-positives often relies on in situ hybridization data, and such data exist for only 26% (2352/9216) of the clones in the library. Chimeric clones result from genomic DNA fragments representing two unlinked regions of the genome ligated into a single P1 vector. Such chimerism has often plagued mapping projects based on YAC libraries. As many as 50% of the clones in some human YAC libraries are thought to consist of such artifactually jointed inserts. The biological constraints imposed by the P1 packaging extracts should limit the frequency of the formation of chimeric clones. Our results confirm this hypothesis. It is difficult to define unambiguously and precisely the rate of chimerism at this stage in the mapping project. However, some of the results can be used to gain a preliminary estimate. We are currently using the operational definition that a clone is likely to be chimeric if it meets the following criteria: (1) The in situ hybridization results identify two unlinked hybridization sites and (2) STS markers developed from opposite ends of the same cloned insert identify P1 clones that clearly belong to unlinked contigs. To date, we have identified only 10 clones that meet these criteria. This is a small fraction of the ~1500 clones that have been both mapped by in situ hybridization and used as a source of paired STS markers. Redundancy in the library. The early estimates predicted that each genomic region was likely to be represented, on average, five to six times, based on average insert size, the number of clones, and the estimated size of the euchromatic genome. Thus far, an average of 5.04 hits/STS has been observed based on a sample of 2397 completely mapped STS markers. Two factors might cause this assessment of genomic coverage to be incorrect: First, the STSs are derived from clones in the library and thus might be biased towards regions that clone with greater frequency; and second, the redundancy in the library should vary for the autosomes and the sex chromosomes. As the library was generated from an equal mixture of males and females, those sequences on the sex chromosomes should be represented at a slightly lower frequency when compared to regions on the second and third chromosomes. Nature of the contigs and mechanisms of error correction. A major drawback to physical mapping experiments is that the data are not associated with figures of merit. This is in marked contrast to the results obtained with other mapping methods, specifically, genetic recombination mapping and radiation hybrids. We have attempted to minimize these limitations by using approaches that obtain redundant information using multiple and distinct experimental methods. There are two types of experimental objects in the mapping experiments described in this paper: P1 clones and STS markers. The quality control of the data associated with these objects can be seen by an examination of an example contig presented in Figure 4. This contig consists of 48 individual P1 clones. Of these clones, 19 have been assigned to this region of the genome by both STS content mapping and in situ hybridization. All of the STS markers have been derived from sources that have been localized by the chromosomal hybridizations. Sixteen of the STS markers in this contig were derived from the ends of cytogenetically localized P1 clones and one comes from a cytogenetically localized P element.
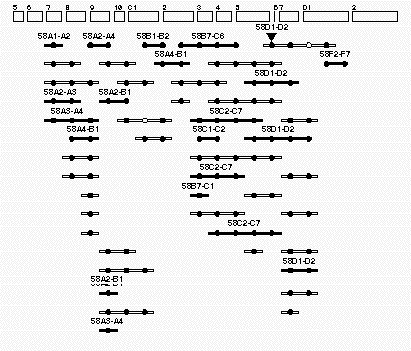 Figure
4. Example of an individual contig This contig is found at region 58 on the Drosophila polytene map. The
rectangles (top )have been drawn to resemble the cytogenetic regions of this portion of the right arm of the
second chromosome. The long-thin rectanges with solid circles represent individual P1 clones that have been localized
to this region of the genome. The P1 rectangles that are filled in have been assigned by both in situ hybridization
and by STS content mapping. The open P1 rectangles represent P1 clones that have been assigned by STS assays alone.
The cirles represent STSs assigned to this region. All the circles that line up in a vertical row correspond to the
same STS marker. The solid circles correspond to STS markers that hit the clones positioned in this genomic region.
The open circles correspond to STS markers that are likely to be false negatives. The inverted triangle represents
the site of a P-element insertion that has been localized to this region by both cytogenetic means and by PCR-based
STS-content mapping.
Figure
4. Example of an individual contig This contig is found at region 58 on the Drosophila polytene map. The
rectangles (top )have been drawn to resemble the cytogenetic regions of this portion of the right arm of the
second chromosome. The long-thin rectanges with solid circles represent individual P1 clones that have been localized
to this region of the genome. The P1 rectangles that are filled in have been assigned by both in situ hybridization
and by STS content mapping. The open P1 rectangles represent P1 clones that have been assigned by STS assays alone.
The cirles represent STSs assigned to this region. All the circles that line up in a vertical row correspond to the
same STS marker. The solid circles correspond to STS markers that hit the clones positioned in this genomic region.
The open circles correspond to STS markers that are likely to be false negatives. The inverted triangle represents
the site of a P-element insertion that has been localized to this region by both cytogenetic means and by PCR-based
STS-content mapping.
Inconsistencies in the mapping data become obvious immediately when the two complementary mapping methods are used on the same set of mapping clones. Clones assigned to one region by one technique and to a second by another technique can be identified readily. Such clones are discarded by the contig building algorithm. However, the data are tracked and can be retrieved as they may be useful in subsequent error correction experiments. Tracking the data associated with the STS markers can also be helpful in eliminating both experimental errors or artifactual results. Experience suggests that the most prevalent source of error associated with these markers is a mishandling of the data or the reagents during the series of procedures that are involved during the journey from a clone in a microtiter well to a sequence to a map position. For example, clones can be incorrectly selected from the microtiter plates prior to sequencing, clones can be mislabeled at any step along the way, and misordering of the PCR primers can occur. However, the nature of our experimental organization allows a specific prediction to be made: STSs derived from the ends of P1 clones should hit their source clones when the library is screened. STSs that identify their source when used to screen can be assigned a higher confidence level than those that do not. Each of the STS probes used to develop the contig presented as an example in figure 4 hit their source clone and provides confirming data that validate the manipulations used to develop and map each of these STSs. The combination of multiple independent mapping mechanisms and the requirement that the end-derived STS markers hit their source clones strengthens the overall quality of the map developed in the course of this work.
DISCUSSION Strategic choices In the introductory section, several mapping choices were mentioned, that is, vector type, method of overlap detection, and source of STS markers. There are several criteria upon which these mapping decisions can be considered. Minimal benchmarks include a comparison of the fraction of the genome covered by the ordered arrays (or contigs), the average size of the contigs, and the cost, in terms of time and resources, required to generate the map. Other standards include the flexibility of the map, community access, the potential to use the map to provide substrates for large-scale genomic sequencing, the biological content of the map, and the correlation of the clone-based physical map with the genetic map and the polytene map. When we began these experiments, maps of the Drosophila genome based on libraries in yeast artificial chromosomes (YACs) had been developed (Ajioka et al. 1991;Cai et al. 1994).A deliberate decision was made to not pursue closure with these maps and libraries. Some cloned inserts in YACs are known to be predisposed to certain classes of artifacts, such as instability and chimerism. In addition, it is important to note that the insert sequences in YAC clones have proven difficult to purify in amounts comparable to what can be obtained from E. coli -based plasmid sources. This is a key consideration if the clones from the physical map are going to be used as a source of templates for large-scale genomic sequencing. Cosmids have been the most common choice for physical mapping efforts associated with genomic sequencing projects. The cloned inserts in cosmids are less than half the size of the fragments in P1 clones. Thus, if we had decided to base our mapping project on cosmid libraries then the mapping set would have to be more than twice as large to provide the same degree of coverage, twice as many STSs would have to be mapped in order to assign all clones in the library to contigs, and the average size of each contig would be half as large. Furthermore, if the mapping library is generated in a P1 vector, fewer clones will have to be purified and subcloned in the subsequent large-scale sequencing effort. Evidence accumulated from other laboratories that indicates that large inserts are more stable in single copy plasmids (such as P1 clones, PACs, and BACs) than they are when cloned into multicopy plasmids (such as cosmids) (Kim et al. 1992). Our experiments do not directly address these issues. However, the work to date has yet to identify even a single unstable clone. With this issue in mind, it is important to point out that all pooling, library replication, and DNA preparation protocols were carried out on saturated overnight cultures. In contrast cosmids are prone to instability with such "rough" handling. The completion of this stage of the Drosophila map verifies the utility of the non random STS selection scheme that we devised several years ago. Similar results were obtained in the generation of the map for Schizosaccharomyces pombe using a similar mapping strategy (Mizukami et al. 1993). Three to four times as many STS markers would have been needed to reach this same state of completion if the STSs had been chosen in a random fashion. Data accessibility These mapping experiments were conducted not only to provide templates for large-scale sequencing but also to promote the positional cloning efforts of the Drosophila research community. Sixteen copies of the mapping library were generated at LBNL using the library replication system developed by Joe Jaklevic's LBNL HGC Automation group. These copies were then mailed to individual laboratories in diverse geographic locations that agreed to assume the responsibility for distributing clones to researchers in their region. The distribution centers cover North America, Europe, and Asia. The information concerning P1 in situ hybridization results and STS content mapping has been made available to the research community developed in a collaboration between Flybase and the Berkeley DGC. Further, we decided to use an STS content mapping strategy to identify clone overlaps were because this approach would provide a benefit to the community. STS content maps are not only based on a set of clones, but on the information content of the genome. All of the mapped sequence tags have also been made available to the community. For almost every genomic region it is now possible to find small patches of sequence that can be used to screen a genomic library made in any vector. Future directions To date, almost all of the clones identified as euchromatic by Hartl's hybridization experiments have now been assigned to contigs by STS content mapping. This has resulted in 649 P1-based contigs that together probably represent > 110 Mb of the 120-Mb euchromatic genome. Still, 2832 clones remain unmapped. This class includes clones about which there is, as of yet, no mapping information. It is likely that this collection of unassigned clones represents the remaining unmapped euchromatic regions as well as regions of cloneable heterochromatin. Experiments to incorporate these clones into the map are currently underway. These map completion experiments will continue the utilize the paired STS strategy that takes advantage of nonrandom approach for STS selection and in situ hybridization to the polytene chromosomes of Drosophila.
METHODS Generation of DNA Pools For PCR-Based Mapping. The pools were generated by growing up the clones of an individual microtiter plate in a titer tube box containing in each tube 0.4 mL TB plus 25 g/ml of kanamycin at 37°C overnight. Thus, each clone was grown separately prior to pooling to avoid sib competition. The pools were then made by combining the appropriate clones in a box after growth. For the generation of a plate pool, one titer tube box per plate was grown. For the generation of the row and column pools, two titer tube boxes were grown for any one plate. One box was used to make the 12-row pools, and the other was used to make the 8-column pools. Once the clones were pooled appropriately, the cells were sedimented, washed with sterile water, and resedimented. For preparation of the plate pools we followed a standard triton-lysozyme boiling DNA preparation protocol (Smoller et al. 1993). The crude DNA preparation was further treated with RNase A to degrade contaminating RNA, then extracted with phenol:chloroform to remove any residual proteins. After a final ethanol precipitation the plate-pool DNA was suspended in 0.5 mL 10 mM Tris-HC1, 1mM EDTA (TE). For the preparation of the row and column pools, essentially the same protocol was followed except the phenol:chloroform extraction was omitted and the row and column pools were suspended in 0.1 ml TE rather than 0.5 mL as for the plate pools. The amounts of DNA pools generated are sufficient for >15,000 STS screens. This represents a vast excess of the number of screens needed to complete the clone-limited phase of the mapping project, and likely the map closure phase of the project as well. STS Content Mapping By Polymerase Chain Reaction. To map an STS marker the PCR screening procedure is organized into two levels. The top level screen uses the 96-plate pool samples. Using the data derived from this first screen the appropriate set of 20-row and -column pools is then selected to analyze for the second level of screening. This pooling strategy is designed to retain the 8 x 12 microtiter format which allows for more opportunities to incorporate informatics and automation solutions. In addition, the pooling strategy lowers the number of PCRs required to map a single STS marker. In a five-hit library pooled as described, a typical STS requires 196 PCRs to complete: 96 for the top level plate pool and five sets of 20 PCRs for the ensuing row/column experiments. The PCR reactions are run in the Perkin Elmer 9600 thermocyclers. The PCR reactions are in a final volume of 15 µL that contains 0.4 µM each forward and reverse primer, 0.2 mM dNTPs, and 0.04 U/µL Taq polymerase. The sample of P1 pool DNA used is equivalent to a 1:500 dilution of stocks generated as described above. The reactions are first denatured at 95°C for 2.5 minutes then 30-35 cycles using the following parameters are carried out: 96°C for 15 sec, 58°C for 15 sec, 72°C for 30 sec. Occasionally some primer pairs work better at an annealing temperature of 55°C or 52°C. This parameter is determined empirically for each primer pair by testing them in PCR using fly genomic DNA as template. After PCR is carried out using the P1 DNA pools as template, the samples are analyzed by agarose gel electrophoresis using 2% agarose gels and standard Tris/borate/EDTA buffer to determine which plate pools generate a PCR product of the appropriate size. Acknowledgements We would like to thank all of our colleagues in the HGC of the LBNL and the Berkeley-based DGC. Special thanks to Joe Jaklevic and the LBNL Automation Group, Frank Eeckman and the LBNL Computation group, and the Informatics group of the DGC. We acknowledge Todd Laverty for performing the in situ hybridization experiments that verified the positions of some of the mapped contigs. Thanks go to Mohan Narla and Gerald Rubin the DGC Directors. We would also like to acknowledge superb administrative assistance of Joyce Pfeiffer. This work is part of the consortium known as the DGC supported by grants from the National Center for Human Genome Research (P50-HG00750 to Gerald Rubin, Allan Spradling, M.J. P. and C.H.M.) and HGC of the LBNL which is supported by the U.S. Department of Energy under Contract no. DE-AC03-76SF00098. M.J.P. is a Lucille P. Markely Scholar and his effort was funded in part by the Lucille P. Markey Charitable Trust. Finally we thank Gerry Rubin and Allan Spradling for a critical reading of the manuscript prior to publication.
REFERENCES Ajioka, J. W., D. A. Smoller, R. W. Jones, J. P. Carulli, A. E. Vellek, D. Garza, A. J. Link, I. W. Duncan and D. L. Hartl, 1991 Drosophila genome project: one-hit coverage in yeast artificial chromosomes. Chromosoma 100: 495-509. Altschul, S. F., W. Gish, W. Miller, E. W. Myers and D. J. Lipman, 1990 Basic local alignment search tool. J. Mol. Biol. 215: 403-410. Bender, W., M. Akam, F. Karch, P. A. Beachy, M. Peifer, Spierer, P. and E. B. Lewis, 1983 Hogness, D.S. Molecular genetics of the bithorax complex in Drosophila melanogaster. Science 221: 23-29. Booth, K., and G. Leuker, 1976 Testing for the consecutive ones property, interval graphs and graph planarity using PQ- algorithms. Journal of Computer ans System Sciences : 335-379. Bridges CB, 1935 Salivary Chromosome Maps. Heredity 26: 60-64 Burke, D. T., G. F. Carle and M. V. Olson, 1987 Cloning of large segments of exogenous DNA into yeast by means of artificial chromosome vectors. Science 236: 806-812. Cai, H. J., P. Kiefel, J. Yee and I. Duncan, 1994 A yeast artificial chromosome clone map of the drosophila genome. Genetics 4: 1385-1399. Celniker, S. E., D. J. Keelan and E. B. Lewis, 1989 The molecular genetics of the bithorax complex of Drosophila: characterization of the products of the Abdominal-B domain. Genes Devel. 3: 1425-1437. Coulson, A. R., J. Sulston, S. Brenner and J. Karn, 1986 Toward a physical map of the genome of the nemato de caenorhabditis elegans. Proc. Natl. Acad. Sci. USA 83: 7821-7825. Dunham, I., R. Durbin, J. Thierry-Mieg and D. R. Bentley, 1994 Physical Mapping Projects and ACEDB in Guide to Human Genome Computing (ed. M. J. Bishop), pp. 111-158. Academic Press, San Diego, CA. Green, E. D., and M. V. Olson, 1990 Systematic screening of yeast artificial-chromosome libraries by use of the polymerase chain reaction. Proc. Natl. Acad. Sci. USA 87: 1213-1217. Hartl, D. L., D. I. Nurminsky, R. W. Jones and E. R. Lozovskaya, 1994 Genome structure and evolution in Drosophila: applications of the framework P1 map. Proc. Natl. Acad. Sci. 91: 6924-6829. Ioannu, P. A., C. T. Amemiya, J. Garnes, P. M. Kroisel, H. Shizuya, C. Chen, M. A. Batzer and D. P. J., 1994 A new bacteriophage P1-derived vector for the propogation of large human DNA fragments. Nature Genetics 6: 84-89. Karch, F., W. Bender and B. Weiffenbach, 1990 abdA expression in Drosophila embryos. Genes and Dev. 4: 1573-1587. Kim, U., H. Shizuya, P. J. d. Jong, B. Birren and M. I. Simon, 1992 Stable propagation of cosmid sized human DNA inserts in an F factor based vector. Nucleic Acids Res. 20: 1083-1085. Kimmerly, W. J., A. L. Kyle, V. M. Lustre, C. H. Martin and M. J. Palazzolo, 1994 Direct sequencing of terminal regions of Genomic P-1 clones. GATA 11(5-6): 117-128. Kohara, Y., K. Akiyama and K. Isono, 1987 The physical map of the whole E. coli chromosome: application of a new strategy for rapid analysis and sorting of a large genomic library. Cell 50: 495-508. Kornfeld, K., R. B. Saint, P. A. Beachy, P. J. Harte, D. A. Peattie and D. S. Hogness, 1989 Structure and expression of a family of Ultrabithorax mRNAs generated by alternative splicing and polyadenylation in Drosophila. Genes Dev. 3: 243-258. Martin, C. H., C. A. Mayeda, C. A. Davis, C. L. Ericsson, J. D. Knafels, D. R. Mathog, S. E. Celniker, E. B. Lewis and M. J. Palazzolo, 1995 Complete sequence of the bithorax complex of Drosophila. Proc Natn'l Acad Sci USA 92: 8398-8402. Mizukami, T., W. I. Chang, I. Garkartsev, N. Kaplan, D. Lombardi, T. Matsumoto, O. Niwa, A. Kounosu, M. Yanagida, T. G. Marr and et. al., 1993 A 13 kb resolution cosmid map of the 14 Mb fission yeast genome by nonrandom sequence-tagged site mapping. Cell 73: 121-132. Nurminsky, D. I., and D. L. Hartl, 1993 Amplification of the ends of DNA fragments cloned in bacteriophage P1. Biotechniques 15: 201-202, 206-208. Olson, M., L. Hood, C. Cantor and D. Botstein, 1989 A common language for physical mapping of the human genome [see comments]. Science 245: 1434-1435. Olson, M. V., J. E. Dutchik, M. Y. Graham, G. M. Brodeur, C. Helms, M. Frank, M. MacCollin, R. Scheinman and T. Frank, 1986 Random-clone strategy for genomic restriction mapping in yeast. Proc. Natl. Acad. Sci. USA 83: 7826-7830. Palazzolo, M. J., B. A. Hamilton, D. Ding, C. H. Martin, D. A. Mead, R. C. Mierendorf, K. V. Raghavan, E. M. Meyerowitz and H. D. Lipshitz, 1990 Phage lambda cDNA cloning vectors for subtractive hybridization, fusion-protein synthesis and Cre-loxP automatic plasmid subcloning. Gene 88: 25-36. Palazzolo, M. J., S. A. Sawyer, C. H. Martin, D. A. Smoller and D. L. Hartl, 1991 Optimized strategies for sequence-tagged-site selection in genome mapping. Proc. Natl. Acad. Sci. 88: 8034-8038. Pardue, J. L., L. H. Kedes, E. S. Weinberg and M. L. Birnsteil, 1977 Localization of sequences coding for histone messenger RNA in the chromosomes of Drosophila melanogaster. Chromosoma, 63: 135. Riley, J., R. Butler, D. Ogilvie, R. Finniear, D. Jenner, S. Powell, R. Anand, J. C. Smith and A. F. Markham, 1990 A novel, rapid method for the isolation of terminal sequences from yeast artificial chromosome (YAC) clones. Nucleic Acids Res. 18: 2887-2890. Sindelar, L. E., and J. M. Jaklevic, 1995 High-throughput DNA synthesis in a multichannel format. Nucleic Acids Research 23: 982-987. Smith, D. R., 1992 Ligation-mediated PCR of restriction fragments from large DNA molecules. PCR Meth. Appl. 2: 21-27. Smoller, D. A., W. J. Kimmerly, O. Hubbard, C. Ericsson, C. H. Martin and M. J. Palazzolo, 1993 A Role for the P1 Cloning System in Genome Analysis. In Automated DNA Sequencing and Analysis Techniques. pp. 89-95. Academic Press, New York, NY. Smoller, D. A., D. Petrov and D. L. Hartl, 1991 Characterization of bacteriophage P1 library containing inserts of Drosophila DNA of 75-100 kilobase pairs. Chromosoma 100: 487-494. Sorsa, V., 1988 Chromosome Maps of Drosophila. CRC Press, Boca Raton, Florida. Spradling, A. C., D. Stern, I. Kiss, J. Roote and G. M. Rubin, 1995 Gene Disruption using P transposable elements: An integral component of the Drosophila genome project. Proc. Natl. Acad. Sci. USA 92: 10824-10830. Sternberg, N., 1990 Bacteriophage P1 cloning system for the isolation, amplification, and recovery of DNA fragments as large as 100 kilobase pairs. Proc. Natl. Acad. Sci. USA 87: 103-107. Sulston, J., Z. Du, K. Thomas, R. Wilson, L. Hillier, R. Staden, N. Halloran, P. Green, J. Thierry-Mieg, L. Qiu and e. al., 1992 The C. elegans genome sequencing project: a beginning [see comments]. Nature 356: 37-41. Taylor, R. G., D. C. Walker and R. R. McInnes, 1993 E. coli host strains significantly affect the quality of small scale plasmid DNA preparations used for sequencing. Nucleic Acids Res. 21: 1677-1678. Wakimoto, B. T., F. R. Turner and T. C. Kaufman, 1984 Defects in embryogenesis in mutants associated with the antennapedia gene complex of Drosophila melanogaster. Developmental Biology 102: 147-172.