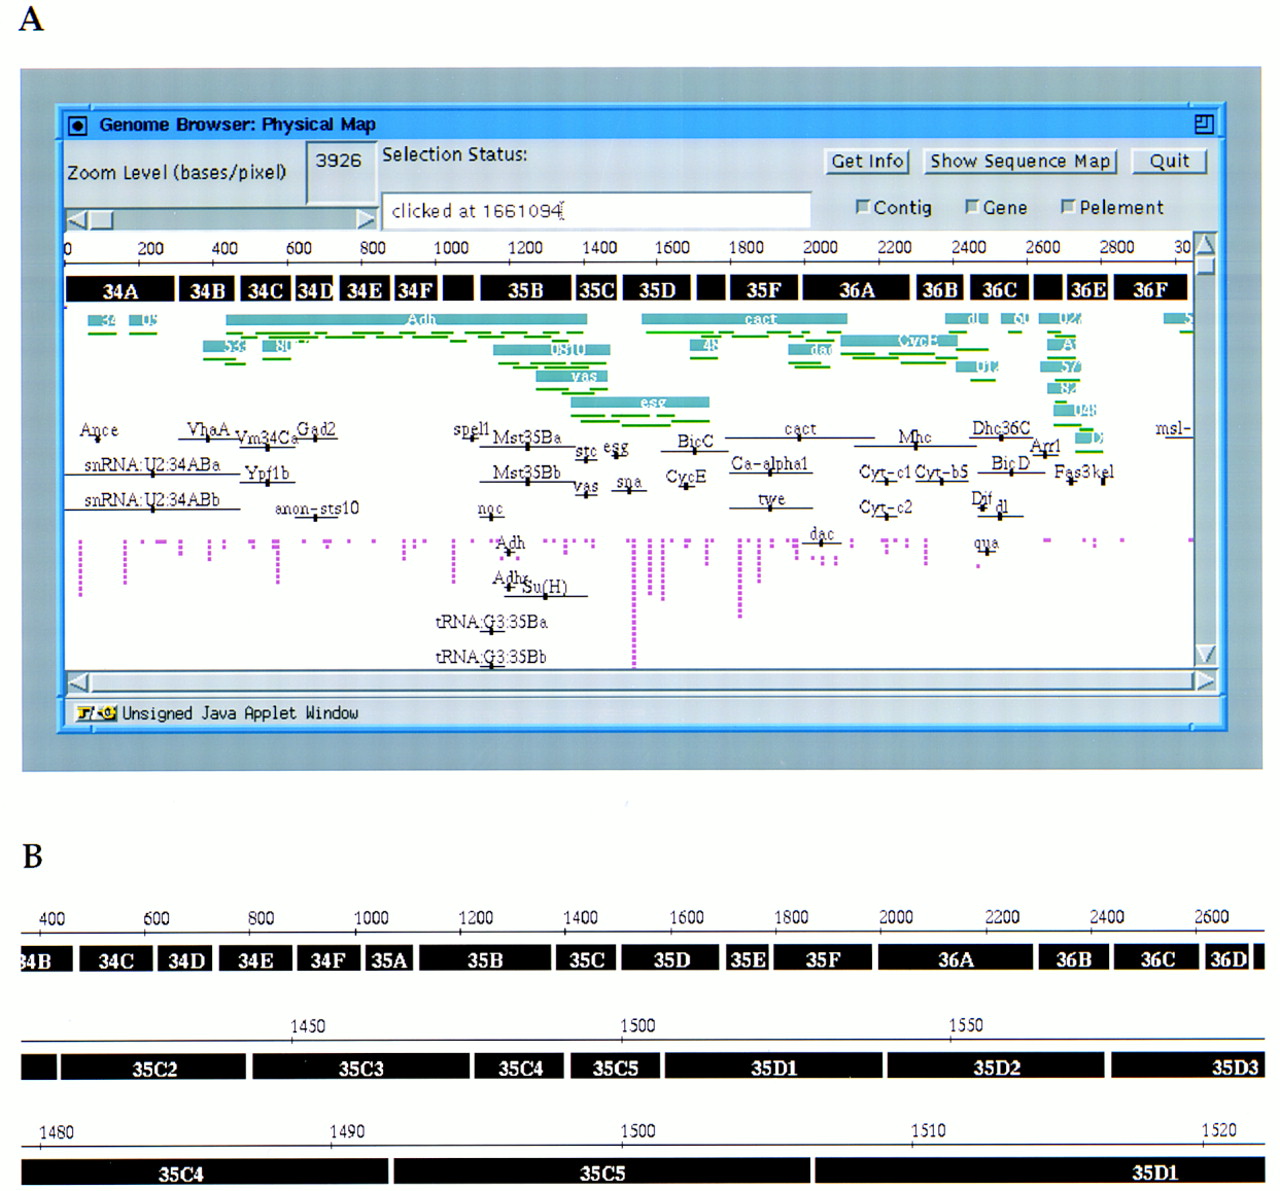
Figure 1 Physical and genetic map viewer. The physical map of a 3-Mb region of Drosophila genomic DNA is displayed within the physical map widget of the Genome Browser. DNA sequence length (kb) is shown at the top of the display. Chromosomal divisions and chromosome bands are shown underneath as labeled boxes. Below the chromosomal bands, the P1 contigs that map to the region are displayed as labeled blue bars, and the P1 clones that make up each contig are shown as smaller green bars underneath their respective contigs. Sequenced P1s are shown in light green. The Physical Map viewer calculates where to place contigs on the map by using the cytogenetic map position of their constituent P1 clones. The length of the contig is estimated from the number of P1s in the contig and the average P1 size, and individual P1s are drawn with a length proportional to the number of STSs contained within the P1 clone. In the current display, only the minimal tiling path of P1s per contig is shown as all the P1 clones for each contig would add much more data to the display but contribute little to the information conveyed. In addition to the contigs, all the genes that have been mapped genetically to the region are displayed as labeled spans, based on their genetic mapping to a range of chromosome bands; these data were obtained from FlyBase (Flybase 1995). Lethal P-element transposon insertions, which have been mapped cytogenetically to this region, are also shown as pink squares at the bottom of the display (Spradling et al. 1995). From this high level view it is immediately apparent that the distribution of mapped P-element insertions is very uneven, which is a recognized biological phenomena where some genomic regions have proven to be "hot spots" for P-element insertion. (A) Low-resolution view. The user has invoked the Physical Map viewer, with the resolution of the display set to the lowest level of detail. At this level of zoom, chromosomal divisions, each comprised of several bands, are shown as labeled black rectangles just below the DNA sequence length scale. (B) Higher-resolution views. Here just the Physical Map viewer chromosomal band display is shown. The user has used the zoom slider at the top left of the display to show successively higher resolution views of the region shown in A. Note that the chromosome divisions (labeled 35C, etc.) shown in A have resolved into their constituent bands (labeled 35C5, etc.) and that finer scale markings have appeared in the kilobase scale.